Submitted in Partial Fulfillment
of the Requirements for the Degree of
Master of Science
In Applied Geospatial Science
College of Social
and Behavioral Sciences
Northern Arizona University
May 2019
Approved:
Ruihong Huang, Ph.D.
Associate Professor, GPR Department
Northern Arizona University
Chair
Erik Schiefer, Ph.D.
Associate Professor, GPR Department
Northern Arizona University
J. C. Kliner, M.S.
GIS Coordinator
City of Apache Junction
|
Abstract |
4 |
|
Acknowledgments |
4 |
|
Introduction |
5 |
|
Study Area |
5 |
|
Background |
7 |
|
Problem Statement |
13 |
|
Objectives |
15 |
|
Literature Review |
15 |
|
GIS Fundamentals |
20 |
|
GIS Products |
20 |
|
GIS Data Formats |
21 |
|
Text File-based Data Storage |
23 |
|
GIS Data |
24 |
|
Smart Features |
26 |
|
Enterprise Geodatabase Features |
27 |
|
The ESRI LocalGovernment Data Model |
30 |
|
Methodology |
31 |
|
Geodatabase Design |
31 |
|
Conceptual Design |
33 |
|
Existing Geodatabase Design Improvement Process |
37 |
|
Existing Feature Dataset: Administrative Areas |
38 |
|
Existing Feature Dataset: Cadastral Reference |
39 |
|
Existing Feature Dataset: Development Services |
39 |
|
Existing Feature Dataset: Economic Development |
40 |
|
Existing Feature Dataset: Election Administration |
41 |
|
Existing Feature Dataset: Geology/Hydrology |
42 |
|
Existing Feature Dataset: Miscellaneous |
42 |
|
Existing Feature Dataset: Network Info |
43 |
|
Existing Feature Dataset: Parcels ROW |
43 |
|
Existing Feature Dataset: Stormwater |
43 |
|
Existing Feature Dataset: Transportation |
43 |
|
Existing Feature Dataset: Utilities |
43 |
|
Logical Modeling |
43 |
|
Implementation |
52 |
|
Timeline |
56 |
|
Conclusion |
56 |
|
References |
57 |
|
Appendix A: Meeting Notes |
58 |
|
Appendix B: Existing Database Schema |
62 |
|
1 |
City of Apache Junction Business Functions |
33 |
|
2 |
Feature Datasets - Logical Groupings of Data |
35 |
|
3 |
Existing Schema Objects not Included in the Improved Schema |
37 |
|
4 |
Miscellaneous feature classes moved to other feature datasets |
42 |
|
5 |
Timeline |
56 |
|
1 |
Study Area - City of Apache Junction, Arizona |
6 |
|
2 |
City of Apache Junction Org Chart as of 2017 |
9 |
|
3 |
The city of Apache Junction Master Zoning and Address map |
10 |
|
4 |
An example Versioning Workflow |
29 |
|
5 |
Parcel Fabric Construct |
40 |
|
6 |
Improved Administrative Areas Feature Dataset Logical Model |
45 |
|
7 |
Improved Basemaps Feature Dataset Logical Model |
46 |
|
8 |
Improved Environmental Feature Dataset Logical Model |
47 |
|
9 |
Improved Land Usage Feature Dataset Logical Model |
48 |
|
10 |
Improved Transportation Networks Feature Dataset Logical Model |
49 |
|
11 |
Improved Utilities Feature Dataset Logical Model |
50 |
|
12 |
Improved IT Networks Feature Dataset Logical Model |
51 |
|
13 |
Example of creating advanced GIS objects in Enterprise Architect for later export into a geodatabase |
54 |
The city of Apache Junction, Arizona has been attempting to install and implement a GIS (Geographic Information System) for many years, but its efforts to do so have been hampered by a lack of funding and the lack of a strategic GIS implementation plan. The city's day-to-day geographic work has been performed manually, and GIS data is scattered among the city's departments, each with either their own proprietary off-the-shelf GIS software, or else recorded on paper. A 5-year GIS Implementation Plan, written by the author, provided a solid roadmap to the eventual funding of a modern, advanced Geographic Information System (GIS), which will help to modernize many of the city's manual processes.
The purpose of this project was to design an enterprise-class geodatabase for the city. It will be capable of capturing and storing geographic-centric data that is currently being maintained manually, and will be a city-wide centralized datastore for all GIS data that is currently maintained by many departments, each in their own way. Data being input into the geodatabase will be capable of being validated, greatly reducing the probability of data entry error. The new system will be able to deliver and share standardized GIS data among all departments.
Keywords: Apache, Junction, geographic, information, science, process, flow, improvements, implementation.
The author thanks the city of Apache Junction and its GIS Coordinator, J.C. Kliner, for their help and guidance on this project. Without their generosity and authorization in releasing the existing geodatabase schema to the author, and providing a graduate internship within a standard internship, this project would not have been possible.
The author would also like to thank Dr. Ruihong Huang for his instruction and guidance, and Dr. Erik Schiefer for his valuable and prompt feedback on certain issues during the implementation of this project.
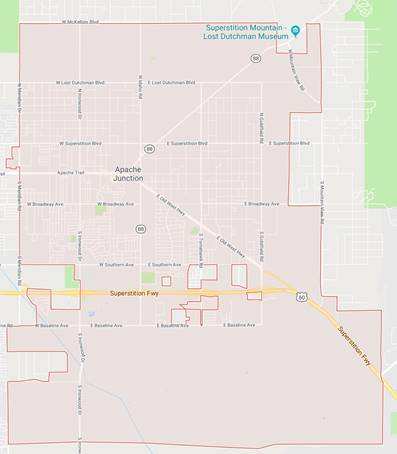
The city of Apache Junction is a small suburb of Phoenix, Arizona. Its current population as of the 2010 Census is about 30,000 in the summer months, increasing to about 60,000 in the winter months as older residents from the northern states migrate to the area to escape the cold weather. It is landlocked, hemmed in by Pinal County lands, the city of Mesa, and federally managed park and forest lands.
The project site consists of the city itself, the Public Works Department buildings to the south, and the City Hall campus, bounded by Idaho Road to the west, Superstition Boulevard to the south, and Apache Trail Road to the east (Figure 1). This campus contains all other municipal buildings not part of Public Works.
At Apache Junction city hall, GIS technology has been identified as a need in a variety of reports completed by separate departments. However, these reports never evaluated the GIS system as a whole, and how they relate across the city. In April of 2016, a small section of the Intelligent Transportation Systems (ITS) Strategic Plan completed by a consultant, described what GIS technology is, what it can be used for, and made some recommendations. One recommendation was the hiring of a GIS coordinator for the city, who would provide citywide implementation guidance, and accelerate the process of gathering base data. Another was the purchase (from ESRI, the Environmental Systems Research Institute) and installation of the latest version of the ArcGIS SDE Enterprise GIS software. This recommendation was significant because it included the purchase of an Enterprise License Agreement (ELA), which would allow access by all appropriate city personnel to all of the ArcGIS software extensions, such as the Spatial Analyst, Network Analyst, and Geostatistical Analyst. Finally, an upgrade of the Public Works Department's current Asset Management System (IworQs) was recommended, to a system which could integrate with the ArcGIS SDE software (Bonifas & Kliner, 2017).
In the fall of 2017, the city manager recognized that a properly organized, planned course of action was needed to implement GIS technology into the city's business functions and service activities. The purpose of this plan was to define a common, unified vision and establish a framework that city departments will use to smoothly and effectively implement GIS technology throughout the city government.
The scope of the plan was developed in two phases. Phase 1 consisted of informational meetings with all relevant city departments, to determine the general state of GIS implementation, and to discover additional needs. Phase 2 included the actual preparation of the plan. The first 2 drafts were reviewed by the immediate supervisor and the GIS user group, with the final draft being reviewed and approved by the GIS steering committee.
The city's GIS department is an ESRI (Environmental Systems Research Institute) Shop, which means that it has implemented ArcGIS Desktop and ArcGIS SDE server software. Microsoft SQL Server is used as the back-end database. This robust, enterprise-class database management system can easily manage the city's GIS data, and can handle many concurrent database connections without an appreciable performance drop. For departments needing decision support, a data warehouse can also be implemented. Connecting to the central GIS geodatabase will be various hardware and software clients that the departments listed above are currently using: Windows-based workstations, wireless handhelds, business-to-business bridging middleware between the geodatabase and various proprietary end-user applications, and a mainframe-based job system. This will enable all GIS data being collected citywide to be stored centrally.
Two ideas that this projects' design will support are to identify processes that can benefit from conversion to GIS and make recommendations as to how they can be converted, and to identify interdepartmental data bridging and exchange needs for departments that have their own proprietary data repositories and applications.
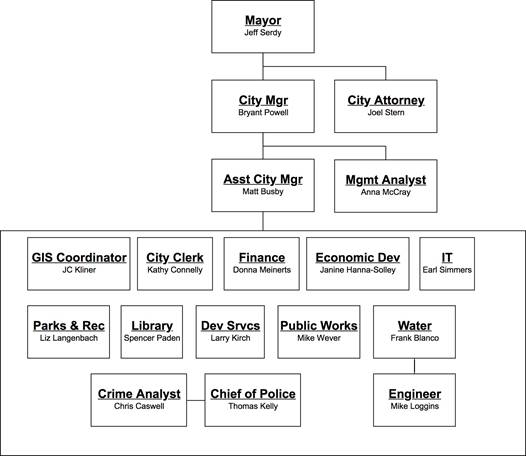
There are eight departments in the municipal government, and three departments that provide city services but are not officially part of the city, that utilize or will potentially utilize GIS data. The city departments all report to the Assistant and City Managers, who in turn report to the mayor: Management Services, Development Services, Public Works, GIS, Police, Economic Development, City Clerk, and Parks and Recreation. The Fire, Water, and Sewer departments are not part of city hall, but are their own separate entities (Figure 2).
Management Services currently does not use GIS data, but they have indicated that they would be interested in certain geodatabase extracts.
The Development Services department is an important organization within the city structure that is responsible for approving building plans, enforcing building codes, and planning for future growth. This department is the biggest user of GIS data, and even though the GIS department is its own separate entity, it is physically located within Development Services. Currently, most of the department's usage is relating to map extracts, but much more is planned. The Master Zoning and Address map, which shows all municipal and county addresses in the city, is in paper form. The geodatabase design that this project produced, when implemented, will support the importing of this map into the geodatabase after all city versus county discrepancies have been resolved.
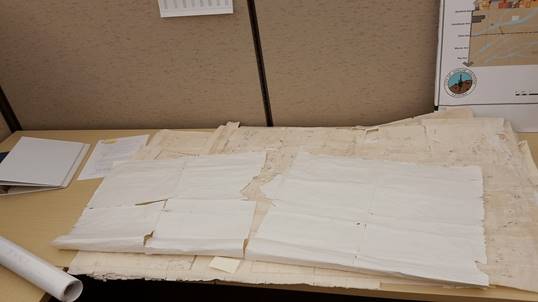
The department's log book is also in paper format (Figure 3). Changes are made by either writing in new information or by crossing out or erasing discrepancies. The geodatabase data model that this project produced, when implemented, will support the importing of this entire log book into the geodatabase. Maintainers of both the map and the log book will be assigned roles and permission sets for data access.
The department is currently using proprietary software called Tidemark. The department is planning to replace this application with an application that can integrate with the geodatabase. The geodatabase design that this project produced will support this.
Development Services personnel have also identified a need to locate and categorize all of the group homes and congregate living facilities within the city limits. This is an important layer for planning staff to utilize because all new applications are required to meet a minimum spacing from existing group home locations. Identifying the spatial distribution of these locations will also help the planning staff in how to update the zoning code language. The geodatabase design that this project produced supports the minimum spacing constraint via a topography rule. Development Services personnel have acquired a list of addresses of group homes and congregate living facilities, which can be geocoded.
Public Works is by far the city's largest department, responsible for maintenance and construction of all the city's roads, streets, street lights, sidewalks, and so on. Currently, the department stores their GIS data for city assets in a proprietary system in the cloud called iWorQs. This asset management system has enterprise GIS capabilities; however, the preferred method of GIS data storage is shapefiles stored on iWorQs system servers. This makes GIS data maintenance difficult because it requires the maintenance of multiple shapefile versions that need to be reconciled on a regular basis. Also, there is a need for a continued effort to map more of the city's maintained assets; these include traffic signals, sidewalks, pavement segments, traffic signs, storm water facilities, and street lights.
Right-of-way (ROW) is described as land that has been dedicated to the general public for use as streets, alleys, sidewalks or public easements. Federally Patented Easements (FPEs) are portions of land that have been granted or reserved for a specific use, like streets or utility access, but have not yet been dedicated to the public. Public Works has previously identified a need to map all of these segments into a GIS, so staff from any department can easily identify the correct designation and lookup corresponding documentation. Having these locations mapped in GIS also help in planning for future easements to be dedicated and also identifying which easements can be eliminated for the public's right to use.
Public Works also utilizes iWorQs to meet the needs for work orders, inspections and regulatory compliance. Previously these functions did not have GIS components, but as the department transitioned from paper forms to digital work management and more GIS functionality became available in iWorQs itself, the department has identified a need to see these locations on a map. Adding this information in GIS provides the department the ability to visualize their work management and highlight areas in the city that have reoccurring issues. (Bonifas & Kliner, 2017).
The Police department is the city's police force. They use GIS data primarily for the location of crime scenes, but also for locating addresses. The city has over 125 mobile home and RV (Recreational Vehicle) parks within its limits. Each park has one public address assigned to it. However, within each park there can be as many as hundreds of individual mobile homes and RVs, each home counting as one private address. This addressing scheme can be difficult to work with by police officers trying to reach a private address. This department has identified a need for a mobile GIS addressing service, not only to address this issue but also for the identification of grid and section addresses.
The Economic Development department promotes the expansion of economic opportunities within the city. It uses land and parcel GIS data to identify available properties and promote development. They have identified a need for a significantly enhanced parcel and land use data model which this project's geodatabase design supports.
The department of the City Clerk is the city's front-facing organization, and is the city's secretarial function. It collects the city's sales taxes, administers the city's audit and licensing programs, provides public notices, maintains city ordinances and resolutions, and administers the city archives and public records program, including maintenance, revision and distribution of the City Code. It also prepares and manages the minutes of the City Council and committee meetings. It is a heavy user of GIS address and parcel data, and requires this data to be as accurate as possible. It is currently reviewing possible replacements to its proprietary tax processing software, with one of the desired features being better integration with GIS software.
The Parks and Recreation department oversees and maintains the city's parks and recreation facilities. Almost all of its processes for logging maintenance activity, managing and organizing recreation services, and integration with other city departments are manual. They do not have an asset tracking system, and all the data that they maintain and process is in large shelves full of notebooks and binders. They would like to have all their data input into the city's geodatabase, then make major changes to their processes to eliminate manual work and recordkeeping.
The GIS department is the smallest department in the city, consisting of a full-time permanent GIS coordinator and between 1 and 3 part-time temporary interns, which fluctuate semester by semester. The GIS coordinator is responsible for the creation and maintenance of the city's enterprise GIS platform, data storage, middleware, and end-user services.
Many of the city's internal procedures relating to the storage, manipulation, and reporting of GIS data - such as the processing of building plans and permits - are more than 10 years old and largely decentralized, manual operations.
The city's departments store, manage, and report their GIS data using proprietary software packages, each department using a different package that may not integrate with enterprise GIS software well or in many cases not at all. None integrate well with each other. Most of the city's departments - including Development Services - store part of or all of their spatial data manually on paper, such as maps, notebooks, and binders. This data is maintained by manual methods, which are inefficient and prone to error. It is also maintained separately by each department, which promotes data duplication.
Prior to the approval of the city's 5-year GIS implementation plan, city funding for the improvement of the city's management of GIS data was so tightly constrained that it took nearly 3 years just to get the go ahead to hire a GIS coordinator. The new GIS implementation plan contains specific goals and objectives for GIS process improvement efforts, including the design of an enterprise geodatabase.
The goal of this project is to design a comprehensive geodatabase data model for the City of Apache Junction that supports most of the city’s GIS related business functions. The objectives are:
1. Gather City GIS Requirements
2. Interview personnel from the city's departments to understand their GIS needs
3. Create a conceptual model based on city functions and needs, organized into conceptual groups
4. Based on the conceptual data, design a logical model for the enterprise geodatabase, including feature datasets, relationships, and topology
5. Create the Implementation Based on the Logical Model
This project involved the design of an enterprise-class geospatial data model, for use in creating a GIS composed of off-the-shelf technologies, hardware, and software, to achieve the overall goal of the city to improve how it stores, maintains, manages, and delivers GIS data to its various departments that use, and make decisions based on, GIS data.
One reason why GIS is such a good fit for governments and utilities is that a large majority of their data is tied to location. It is very important for these entities to know where their infrastructure assets are located, which a well- designed GIS provides. A GIS also features the ability to relate attribute data to location.
Governments and utilities have tended to differ in how they have implemented GIS. Fellers (2013) described the design and implementation of a geographic information system (GIS) for the Water and Server company serving Newberry County, South Carolina. One of the biggest challenges the company had was managing information about maintenance of its infrastructure, even though Newberry County is largely rural. While the county did not have the budget to hire a GIS staff member, they recognized the need and benefits of a functional GIS. One of the most important requirements of the project was to capture the knowledge of an employee who had been with NCWSA (Newberry County Water & Sewer Authority, the utility company) for twenty-eight plus years, and who had announced their retirement.
Obtaining and validating the existing data was a challenge for Fellers. The data was dramatically lacking in metadata that would aid in accuracy and quality assessment. Once this was corrected, a needs assessment was conducted. With the end of the fiscal year approaching at the end of June, it was important to make best use of the GIS funds that were still available. The first planning meeting focused on what could be produced quickly to provide a useful information product by the end of the fiscal year (Fellers, 2013).
The next step was to design a data model that would fit the immediate needs of the NCWSA along with the future needs, without depleting the budget. They started with the local government geodatabase template that can be downloaded from ESRI. This template has a feature dataset that was developed primarily for water utilities.
Through modifications, this template met the needs of NCWSA without the expense of creating a new design. An entity relationship (E-R) diagram was created from the needs assessment to help understand how the feature classes would interact within the database (Fellers, 2013).
Finally, the feature classes, relationships, and topology were designed based on the E-R diagram and the ESRI template. Not all of the dataset and attribute fields from the ESRI template were used as they were not applicable to this project. NCWSA was anxious to get the data in-house and start using it. The biggest obstacle was that they did not have the budget to purchase software or hardware and still continue to build their GIS - A similar situation that will be faced when developing the GIS for Apache Junction. Instead of purchasing ArcGIS software to view a minimal amount of data, it was decided that ArcGIS Explorer would be used to allow NCWSA the ability to view their data in-house. This software gave NCWSA the ability to view the GIS data and run a few simple queries on their existing computer hardware. ArcGIS Explorer allowed NCWSA employees the ability to use the data without having to learn how to use complex GIS software. Employees gained the ability to access information without the hassle of searching for paper maps of a water main data. This pilot implementation gave the NCWSA utility a better understanding of how they use the data, what additional data may be needed, and what direction they want to go for future additions. With hands-on experience employees are now more capable of providing feedback and useful input for future additions to the GIS.
Crawford, D., & Hung (2015) described the design and implementation of a geographic information system (GIS) for the Water, Sewer, and Electric Departments of the city of Calhoun, Georgia. They wrote that most utilities throughout the United States and abroad are planning or implementing an automated mapping-facilities management geographic information system (GIS) according to Cannistra (1999). Over the years, many organizations have come to realize that GIS not only helps manage the existing utility infrastructure, but also can help in the design for future expansion (Shamsi 2002, Croswell 1991).
Like Fellers, Crawford and Hung began by conducting a needs assessment. They met with the water, sewer, and electric departments individually to identify major functions and processes that would need to be included in the GIS implementation. During these meetings, they also identified a number of issues for each department. Data that was not stored manually was stored in AutoCAD.
In the Water department, a number of users would be viewing the data while up to 5 others would be creating and updating the data. The data was in CAD (Computer Aided Design) format, old, and outdated. Many of the assets were sketched in either from employees’ memories or from field photos. In the Sewer department, at least the manholes and pipes had been located using Real-Time Kinetic GPS (GeoPositioning System) equipment. In the Electric department, the data was in AutoCAD, but with no coordinate system or scale. Attribute data was not stored electronically but in the form of labels on the printed CAD drawings.
Once the needs assessment was complete, work on the geodatabase design was begun. They started by reviewing the CAD data structures, and basing the feature classes on them, with significant consultation with the departments on what features should be included in the new system. Since a number of attribute fields were
labels on the CAD drawings, these had to be input manually. However, the planimetric data (roads, bridges, etc) was available from the county GIS department.
To correct existing feature locations in the GIS, and to add new ones, the city’s engineering department utilized RTK (Real-time kinematic) GPS, with the exception of water meters. With these, they used handheld GPS units to work around tree and bush obstructions, then used post-processing software on the collected data. For the electric features, the poles were located and referenced first, then multiple layers were needed to locate the city’s three substations and eighteen circuits.
Overall, implementing the GIS and populating it with data was completed within a three-year timeframe. The GIS today is being used by all departments on a daily basis. The system has become a tool that the departments depend on to carry out their daily functions and decision making. The GIS provides these departments with the ability to analyze and manage their entire infrastructure. (Crawford & Hung, 2015).
In summary, both of the above projects followed a similar plan – gather business requirements, start with a data model template from ESRI, and create the data model as a subset of the template. Based on this, for future projects, the author will be following a similar design pattern when developing GIS data models.
A Geographic Information System is a computer system for capturing, managing, analyzing, and visualizing geographically referenced information, such as spatial data. It is an abstract representation of the real world, with both hardware and software components. Some example GIS operations include:
· capturing spatial data from a remote sensing device taking real time measurements, geocoding the data to give the data a spatial reference, then storing the data
· managing spatial data within the geodatabase by storing different types of spatial data in their proper formats, and grouping the data into feature classes and feature datasets
· analysis of spatial data using a front-end application that can execute complex algorithms on data within the geodatabase
· visualizing spatial data by creating a map based on the spatial data within the geodatabase
There are several popular GIS packages available. MapInfo is a commercial GIS, currently produced by Pitney Bowes. It supports many different file formats, such as shapefiles, comma delimited text, Microsoft Office, bitmap graphics, and supports input from web services such as Bing. MapInfo has an internal database, and it also supports data exchange between SQLite, Oracle, SQL Server, and PostGIS. GRASS GIS is a free, open-source GIS product. GRASS GIS offers vector and raster data analysis functions, geocoding, and can exchange data with various database interfaces, including SQLite, DBF, PostgreSQL, ODBC (Open DataBase Connectivity) databases, and MySQL.
QGIS is another free and open-source GIS product. Its advantages over Grass-GIS is that it does not require the X11 windowing system in order to run on OSX and *nix systems, and its python scripting language interpreter is built in. Like GRASS GIS, QGIS offers vector and raster data support and analysis functions, geocoding, and data exchange support for most popular relational database systems out of the box. Both Grass GIS and QGIS are hosted on MacPorts for OSX, and are also available for other *nix distros and versions of Windows.
Over the years, several file-based data formats for the storage of spatial data have been developed. One of the first, the shapefile, is a vector format developed by the ESRI corporation. It stores spatial data as sets of vectors, supporting point, line, and polygon features. Attribute data is stored in the shapefile in DBASE format. Shapefiles are easy to edit, process quickly, and take up less disk space compared to other data formats, but do not support topological data structures (q.v.). A file system sees shapefiles as a collection of files with different file extensions, and GIS front-end applications such as ArcGIS display a shapefile file collection as one entity.
Another popular vector data format developed by ESRI is the coverage. Coverages are more complex than shapefiles but support topological data structures. A coverage is stored in a file system as a directory tree, or workspace, containing folders that in turn contain the individual feature classes, which are stored as collections of files with different file extensions. The workspace also contains a special folder called info which contains files where the topological data is stored.
GIS data is often stored in AutoCAD DWG files. DWG is a proprietary file format supporting AutoCAD, a computer-aided design and drafting system. This format does not support advanced GIS features such as feature attributes, and typically is read by and then converted to another file format.
In the late 20th century, ESRI integrated spatial data and relational database technology to develop the personal geodatabase data format for its ArcGIS Desktop and SDE family of GIS products. Hosted by Microsoft’s Access database management program instead of a file system and stored in Access .MDB files, the personal geodatabase data model was a significant improvement over previous GIS data formats.
In a personal geodatabase, vector data is stored as objects, instead of simple geometric shapes. This means that spatial features can support advanced behaviors. Geodatabases support domain data structures, which limit the values that attribute data can take on to help enforce data integrity and minimize data entry errors. Geodatabases support feature datasets, which are collections of feature classes, relationship classes, network data structures, and raster data. Feature datasets maintain spatial reference and domain (spatial data precision) information for the objects they contain. Finally, geodatabases support subtypes, a lightweight type of feature class that different topology rules can be applied to.
These enhanced features made the geodatabase data format, and ESRI’s ArcGIS platform, popular among local governments and organizations. However, as the size of geodatabases began to grow geometrically, Microsoft Access’ 2 GB size limit for the .MDB file format was becoming a problem for many end users. To solve this problem, ESRI developed the file geodatabase data format. This format, consisting of a collection of files contained in a folder with a .GDB extension, supports the same features as the personal geodatabase, but also supports a maximum size of 2 TB, removing the 2 GB limit. Moreover, file geodatabases are cross-platform, whereas personal geodatabases are supported only in Microsoft Windows.
At the end of the 20th century, ESRI ported the personal geodatabase data format so that it could be hosted by enterprise-class relational database server platforms, such as Microsoft SQL Server and Oracle. Today, these platforms can host enterprise geodatabases of even higher size limits, and support more advanced features.
Text file-based spatial data is spatial data that is stored in a file system in a variety of ways - in delimited or non-delimited text files, shapefiles, coverages, file geodatabases, and proprietary structured data files, such as XML or JSON (JavaScript Object Notation). Text files are just files with plain text. In delimited text files, each data item is separated by a common character. XML and JSON files are also plain text, but the data items are separated by special sequences of characters called markup which separates and organizes the data items into meaningful structures.
A database is an integrated set of data on a particular subject, organized into related tables. A geodatabase is a database that supports the storage and manipulation of geographic information. A DataBase Management System, or DBMS, is a software application designed to facilitate storage and access to data. A table within the database is a matrix data structure with rows and columns of data. A DBMS stores collections of related tables. The data inside a geodatabase can be read from, or queried, using a standard database language called SQL (Structured Query Language) to generate the desired output. Certain SQL queries, called commands, are used to write data back to the geodatabase in order to maintain its data and data structures.
Geographic Information Systems can support datasets that contain spatial data, non-spatial data, or a mix of both. In a geodatabase, a feature class is a data structure that contains spatial data. Non-spatial data is data that has not been identified to represent geometric properties. Non-spatial data can be related to the geometry of the spatial data. A special kind of non-spatial data, called Metadata, is literally data about data - it is data that describes the data it refers to.
There are two types of spatial data that geodatabases are capable of storing and manipulating: vector, and raster.
Vector data are usually represented by points, lines, and polygons which can be stored as features in a geodatabases. Point objects are features whose size can be ignored; Line objects are features whose width can be ignored but have a distance; Polygon objects are features whose length and width cannot be ignored i.e., have a measurable size. Lines are formed with points, and polygons are formed with woth(?) lines and points.
Raster data can be any kind of data and is structured in the form of a matrix of raster 'cells' that represent an area on the earth's surface. The raster data structure is most often used to model continuous phenomena and data gathered from imaging devices. We will use raster data to represent basemap data in the geodatabase for output as backgrounds on maps.
Networks are collections of related vector objects and connectivity rules. Utility networks, or geometric networks, derive edge and junction data structures from their feature classes in order to determine flow and flow direction. Transportation networks, or network datasets, determine the shortest path between two points, and can be directed (unidirectional) or non-directed (bidirectional). Feature datasets are collections of related spatial objects that share a common spatial reference and domain. A spatial reference is a mathematical transformation of the earth's round surface to a flat map sheet, based on a defined coordinate system. A spatial domain represents the level of precision of the data inside the geodatabase.
A relationship class is a geodatabase object that contains several properties that define how one or more objects in the geodatabase relate to each other. Relationship classes support similar features that non-spatial relationships support – cardinality, primary and foreign keys, and reification. A geodatabase relationship class supports one of three cardinalities - one-to-one, one-to-many, or many-to-many. A relationship between two objects is maintained by special properties called keys. There are two kinds: primary and foreign. Primary keys uniquely identify a record, or tuple; foreign keys are a field or fields that refer to the primary key in another geodatabase object.
The collection of rules defining relationships between spatial objects in a geodatabase or coverage is called a topology. The purpose of a topology is to manage spatial relationships and enforce data integrity rules such as constraints. There are three basic types: connectivity, contiguity, and area definition.
In topology, a node is the beginning or ending point of a line segment. An arc is a line that has a 'from', or beginning node and a 'to', or ending node. Connectivity topology defines that all arcs have defined from and to nodes, and that arcs are only connected to other arcs at nodes. Contiguity defines that since all arcs have a direction, they enable lines to have left and right polygons. Area Definition defines that polygons are areas that are always enclosed, and only enclosed by a sequence of connected arcs.
Enterprise geodatabases are hosted on server systems running an enterprise RDBMS such as SQL Server or Oracle.
Because enterprise geodatabases are implemented by database management systems that are hosted on servers, typically executing on their own machine or clusters of machines, they can support access from many concurrent connections that are either on the servers' local network, or located elsewhere and are connecting to the server via the internet.
Domains are constraints on attributes in order to manage the values that those attributes can be assigned. Domains are a kind of rule, like topological rules, that typically assign a range of permissable values that an attribute can take on. Their purpose is to enforce data integrity in feature classes and tables, and are created at the geodatabase level. There are two types of domain object: range, and coded. A range domain specifies a valid range of values for a numeric attribute. When creating a range domain, you enter a minimum and maximum valid value. A range domain can be applied to numeric and date attribute types. Coded domains can apply to any type of attribute - text, numeric, date, and so on. Coded value domains specify a valid set of values for an attribute.
Subtypes are lightweight versions of feature classes that can have different names and domains assigned to them. For example, a Road feature class could have several subtypes such as Street, Freeway, Alley, and Boulevard.
Each subtype in the Road feature class could have a different width domain, maximum speed, and so on. Subtypes can participate in topologies as well.
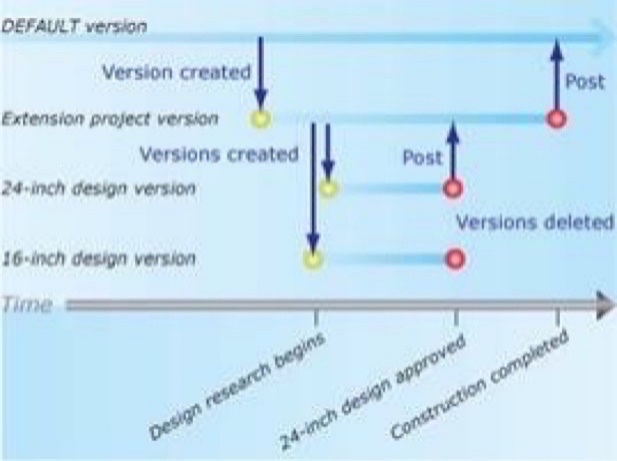
A greatest advantage of enterprise geodatabase over personal and file geodatabase is its support of multiple users, especially its capability of allowing multiple users to edit a dataset concurrently via versioning without applying locks or duplicating data. Each user working on the dataset has their own private view of the data, called a version, with the geodatabase maintaining each user's view and managing updates to the state of the geodatabase made by each user. When a dataset is registered as versioned, a default version is created. A default version is a special version that is the ancestor of all other versions of the data being worked on, and represents the current state of the data in the geodatabase. The default version can be edited and it exists until the dataset is unregistered as versioned. When a user updates their version, the geodatabase maintains changes to the data in special data structures called delta tables. When a user has finished updating their version and wants to reconcile it to check for errors, the geodatabase will compare the data in the delta tables against the versions’ parent, and return any conflicts present. When a user posts a version to the database, the changes contained in that version are merged into its ancestor version. At predetermined times, the geodatabase administrator initiates a transaction event to merge all reconciled changes in all outstanding versions to the geodatabase, and clear the default version. See Figure 4 for a visual view of a user versioning workflow.
This mechanism allows teams of users to work on, for example, large and complex datasets concurrently, with all changes being periodically consolidated back to the geodatabase. Moreover, before a dataset can participate in a newly created topology, network dataset, geometric network, or parcel fabric, it must be unregistered as versioned. Once the topology, network dataset, geometric network, or parcel fabric is complete, the dataset can be registered as versioned if desired. This is because when a feature is being modified by a user in a network, topology, geometric network, or parcel fabric, not all the features lock, which means that other users can edit another part of the network, topology, or parcel fabric in a way that conflicts with the users' edits. Finally, workgroup geodatabase feature datasets can only be accessed and modified through a version. A version is specified at time of connection. By default, you connect to the default version.
Archiving is a feature supported by enterprise geodatabases that provides the functionality to record and access changes made to data (specifically, the default version) in a geodatabase. Geodatabase archiving is the mechanism for capturing, managing, and analyzing data change history. Archiving can be enabled on feature classes, feature layers, and tables as well as feature datasets. History can be recorded as either valid time, transaction time, or Coordinated Universal Time (UTC). Valid time is the actual moment at which a change occurred in the real world and is typically recorded by the user who is applying the change.
Archival data can be analyzed as it changes over time. This can provide decision makers with useful information when solving problems. For example, a forest ranger could enable geodatabase archiving to monitor the spread of a conifer tree disease over time. Later, by examining how the disease is spreading from tree to tree, national forest management can better allocate resources to contain the spreading.
When the default version is changed, such as edited directly by the user or posted with a version, all changes are archived in a set of archive tables. The difference between the time of the real-world event and the transaction time may seem insignificant, but it becomes more apparent when queries are performed against the archived information. Backlogs in editing and updating data are not uncommon in production systems, and they result in the time difference and lag between valid and transaction time. The difference between valid and transaction time is also an issue in situations where history is recorded in a multiuser environment with many different users or departments editing the database. The sequence in which changes are performed and logged in the database may not be the same order in which those changes occurred in the real world. Archiving on non-versioned data uses UTC to represent time. Changes to the data are recorded when edits are saved during an edit session. (ESRI, 2018)
A data model is a description or view of the real world, particularly a framework that defines how to describe the real world. The conceptual model describes a GIS from the user's perspective. The logical model describes the data pieces and the relationships between them, and is usually designed in UML (Universal Modeling Language). The physical model describes the technical details of how to store, organize, and process the data, as well as how to output the information.
Apache Junctions' GIS coordinator, and the author, concurred that it would be far faster to create an enterprise GIS design based on one of ESRI's proven data model templates, instead of creating a design from scratch. The documentation accompanying ESRI's LocalGovernment Data Model includes a data dictionary that describes each element in the schema in detail, and is a primary reference for development. We utilized this model as a guide when developing our design.
The methods and best practices described here will be presented within the context of a simulation.
We researched this project with a review of literature and exercises provided in the enterprise geodatabases course at Northern Arizona University, and an examination of Esri's LocalGovernment Data Model that the city's existing geodatabase was based on.
The design of a geodatabase is probably the most important phase of a GIS implementation. It is also the largest and most complex by far. To be successful, the GIS implementation must provide information that is appropriate and useful to all potential users of the city government, regardless of level of specialization, technical literacy, or department.
We conducted a procedure for geodatabase design similar to Zeiler’s five basic steps (Zeiler, 1999), below, to meet this goal. Each step is outlined below, each with a brief description of how we did it:
1. Model the user’s view of data: Identify organizational functions, determine the data needed to support each function, then organize the data into logical groupings. We surveyed the current condition of the city government by interviewing a number of personnel from each department. We scheduled meetings with representatives from all the city government's departments - our stakeholders - that would use or potentially could use GIS data. Three of those departments - Water, Fire, and Sewer - are separate entities and are not technically part of the municipal government, but we made a best effort to bring them onboard. At each meeting, we took notes on items that were being discussed. Then after each meeting we reviewed those notes, and incorporated what we learned into our overall design strategy as stakeholder requirements. At times, it was difficult to identify the data needed because the interviewees were not fully engaged, but in the end, we were able to at least understand their business functions well enough to develop the logical groupings.
2. Define objects and relationships: Identify and describe objects, specify the relationships between objects (if any), then develop the Logical Model. The LocalGovernment data model was a powerful aid in the design of our logical model. The city of Apache Junction is small enough that the relationships between objects were not complex, and the number of relationships required were manageable. We used the Draw.io web application to create the logical model.
3. Select geographic representation: Determine the data types that will represent the data. We chose to place raster, or continuous data, in the Basemaps feature dataset, and everything else would be input as vector data in the form of points, lines, and polygons.
4. Match to geodatabase elements: Determine geometry type of discrete features, specify relationships between features, and implement attribute types for objects. We completed this in the logical model, taking care not to work on implementation details as that was beyond the scope of this project.
5. Organize geodatabase structure: Organize systems of features, define topological associations, assign coordinate systems, and define relationships and rules. All feature datasets in the geodatabase are set to NAD 1983 HARN StatePlane Arizona East FIPS 0201 (Intl Feet). We completed this in the logical model, taking care not to work on implementation details as that was beyond the scope of this project.
Based on our stakeholder requirement notes, we identified as many municipal functions as we could find, and organized them into a table, shown below, sorted by department.
|
Department |
Existing Data |
GIS Functions |
|
GIS Coordinator |
GIS Internal Data: Basemaps, Rasters, DataOwners Table, MBRs; ArizonaBLM: Surface Mgmt Area PLSS Datasets; ArizonaCAP: Reach body, Centerline; County Boundary: External, Internal, State Boundary; School Districts: Schools, School Districts; Surface Management: Surface Mgmt Lines, Surface Mgmt Area; Rasters: DEM Contour 100', DEM Contour 10', DEM 10m, DEM 10m Hillshaded; Federal Census Data: Zipcodes, Tracts, Groups, Blocks; SRP: Substations, Transmission Lines, Survey Control Points, Parcel Points, Parcel Extents, Addess, Accessways, Working Lines, Working Points; ROW Area: Subtypes; MAG (Maricopa Assoc of Govts): Employees; Elections: Polling Places, Legislative Districts, Voter Precincts; Solid Waste Disposal: Pickup Routes, Hospitals, Wilderness Areas, Historical Monuments, Airspace, Municipal Building Footprints, Unmaintained Swimming Pools |
GIS Development and Maintenance, Datasets external to the city, Features and datasets related to GIS functions |
|
Development Services |
Address Grid: Lines, Grid; Land Ownership, Municipal Boundary: Mesa, Apache Junction; Apache Junction Annexation Zones: Industrial, Residential, Commercial, Parcels; Developments |
Planning, Building Permits, Building Code Maintenance and enforcement, Land Usage, Zoning Maintenance and Enforcement, Grants Administration |
|
IT |
Equipment Vaults, Network Closets, Fiberoptic Lines |
Develops and Maintains Information Technology |
|
Fire District |
Boundary, Fire Stations |
Maintains emergency location data, dispatch routes, evacuation sites, incident tracking and metrics |
|
Water District |
Hydrants, Meters, Meter Zones, Boundary, Pipelines, Canals, Watersheds: River Subtypes: rivers, creeks, washes, Floodplains; Faults, Restraints, Rain Gauges |
Water storage, delivery, and management; water delivery and processing equipment maintenance; incident and usage tracking and metrics |
|
Economic Development |
Redevelopment Areas |
Chamber of Commerce, business environment improvement, economic development land management |
|
Parks & Recreation |
Motorized Vehicle Gates, Hiking Trails, Bike Routes, Parks, Building Footprints, Horse Trails |
Development and Maintenance of city park areas and maintenance equipment, usage tracking and metrics, trail/road/sidewalk/parking lot maintenance |
|
Public Works |
Stormwater Systems: Channels, Culverts, Outfalls, Wet Crossings, Maintenance Areas, Cleanouts, Inlets, Manholes, Drains, Crosswalks; Streets: Roads, Traffic Signals; Street Signs: Mileposts, Sidewalks |
Utility structures and equipment installation and maintenance, Traffic structures and equipment installation and maintenance, emergency location data, dispatch routes, work tracking and maintenance, performance metrics, demand analysis and metrics |
Table 1. City of Apache Junction Business Functions.
We then grouped the data into logical sections, loosely based on ArcGIS technology concepts (Table 2).
|
|
|
|
|
|
|
Table 2. Feature Datasets - Logical Groupings of Data. (Bonifas & Kliner, 2017)
Once we completed the conceptual design, we identified the improvements that needed to be made to the existing geodatabase schema and then created the final geodatabase data model, based on the conceptual design but incorporating the improvements discussed below.
The geodatabase for the City of Apache Junction adopted the Esri’s LocalGovernment model with some changes such as editing and deleting geodatabase objects. Many objects were not simply deleted but marked as redacted. Some objects had been renamed.
It was decided that many schema objects that were unnecessary or that had been marked as redacted would be ignored. The table below shows these objects, and the reason why they would not be included in the improved schema.
|
Schema Object not included |
Reason |
|
FromPinalCounty |
All contained objects marked as redacted |
|
MetaModels |
Internal to Enterprise Architect |
|
XSDDatatypes |
|
|
SpatialReferences |
All contained objects were duplicates of the common spatial reference |
|
Elevation |
Not initially listed in the Enterprise Architect workspace, it appeared in ArcCatalog, and contained only raster objects. All raster objects in the initial existing schema were moved to the Basemaps feature dataset. |
Table 3. Existing Schema Objects not Included in the Improved Schema.
This left the feature datasets and the domains to work. It was decided that all domains would be included because the majority of them were already in use, and the rest were either workarounds for certain unsolvable issues, or else reserved for future use. We will now discuss each existing feature dataset in the AJCITY geodatabase schema, and the work that was done related to it that was included in the improved geodatabase schema.
There are several feature classes in this dataset that seem unnecessary or out of scope when considered for this project. They will be kept on reserve for future implementations. Feature classes relating to Bureau of Land Management activities are federal level. The Unincorporated Communities feature class represents areas within the city limits that are not actually part of the city but are instead part of Pinal County. The Annexations feature class is supposed to represent any areas that get annexed to the city limits in the future, but the city is landlocked. The land ownership and address grid feature classes are more properly part of the Land Usage feature class, where their data can be incorporated into the Parcel Fabric data structures.
The Administrative Areas feature dataset includes boundary feature classes for the city and county. All geodatabase objects should be contained within these boundaries. The different types of districts - school, fire, election, legislative, police precinct - are included in the design as polygon feature classes. The point feature classes representing individual objects within each district - such as an individual school – contain foreign keys pointing back to the primary keys of their related district feature classes. Schools and employment centers are subtyped. School crosswalks are related to schools via foreign key.
The Cadastral Reference feature dataset is a representation of data from the Public Land Survey System (PLSS). The GIS coordinator uses these feature datasets as a reference to position land usage parcels and plats with extreme accuracy. The feature classes in this dataset were moved to the new Basemaps dataset (Figure 6) as that is where the GIS coordinator prefers to place objects that are for GIS internal use only and do not need to be visible to end users.
This dataset contains several feature classes that appear to be duplicates of part of the data in the Developments feature class and its subtypes (Appendix B.4). These duplicates were converted to subtypes of the Developments feature class. Three feature classes - Zoning_2014, Planning_Area_GP2010, and Building_Setbacks - appeared to be temporary then abandoned, were not included in the improved schema, and will be kept for future implementations.
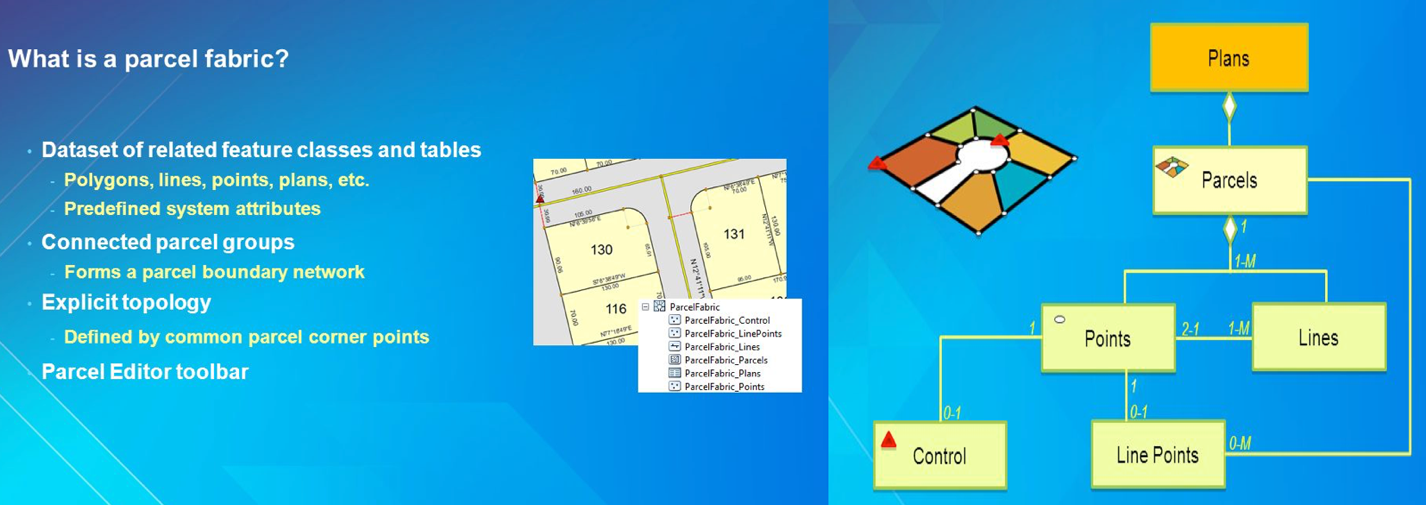
The Developments feature class and its subtypes were re-implemented in the improved schema as the Parcel feature class and its subtypes, a Parcel Fabric construct (the Plan, Parcel, and Parcel_Type tables). This required the adding of 2 new domains and some relationships. A parcel fabric stores a continuous surface of connected parcels or parcel network (Figure 12). Common points between parcels establish connectivity and maintain internal topological integrity in the network. Parcel points store x, y, z coordinates which locate the parcel on the ground. Line points are assigned to parcel points that lie on an adjacent parcel boundary but do not split the boundary. Line points constrain the parcel point to lie on its adjacent parcel line. Control points are assigned to parcel points when running a fabric adjustment. Control points constrain and pin down the parcel point in the adjustment[14]. A parcel fabric dataset is created under a feature dataset and inherits the spatial reference of the feature dataset. Parcel fabric objects can be created either in ArcCatalog or ArcMap. When creating a parcel fabric, you can choose to enable it with the- Local Government Information Model- (a model for local governments in the United States). On an enterprise geodatabase, you have the option to set a configuration keyword, which specifies storage and location parameters for optimal space and disk location efficiency[15].
To support the new parcel fabric construct, the Plan feature superclass was added to the schema, with its primary key added to the Parcel feature class as a foreign key. Plan contains a domain constrained attribute called Status, which can be either Conceptual, Under Construction, , or Completed. The Residential Parcel subtype was constrained by a new domain, and the address feature class and its subtypes were spatially constrained by the "Addresses Must Be Inside Parcels" topological rule.
The Bike Route and Hiking/Equestrian feature classes in this dataset were moved to the new Transportation dataset (Figure 9). The MAG Employer and Williams Gateway feature classes appeared to be temporary then abandoned, were not included in the improved schema, and will be kept for future implementations. The Redevelopment_Areas feature class was reimplemented as a subtype of the new Parcel feature class.
All of the feature classes in this dataset are either duplicated in the Administrative Areas dataset (Appendix B.1), or included in the U.S. Census (Demography) dataset (Appendix B.3), and were deprecated in the improved schema.
This dataset included a hodge-podge of feature classes, basically split between Environmental objects, Utility Network objects, and weather related objects. Due to time constraints on completion of this project, the weather related objects were not included in the improved schema, and will be kept for future implementations. The Environmental objects were already represented in the new Environment feature dataset (Figure 7), and the utility network objects were already represented in the new Utility Networks feature dataset (Figure 10). See the Utility Networks and Environment logical model diagrams, above, for a complete picture on how the appropriate feature classes in this dataset were modified. The new Utility Networks feature dataset contains the geometric networks for the improved geodatabase schema.
This dataset was a catchall for any feature class that didn't seem to fit anywhere else at the time it was created. Most of the feature classes in this dataset could be moved to a more appropriate dataset in the improved schema. The table below shows where they were moved. The Green Pools feature class was part of a one-off project and was deprecated. The remaining feature classes are tools used by the GIS coordinator, and were left as is.
|
Miscellaneous Feature Class |
Moved to Dataset |
Figure |
Feature Class |
|
AirTrafficPatternAirspace |
Transportation Networks |
Airspace |
|
|
AJCity_Parks |
Environment |
Parks |
|
|
Wilderness_Area |
Environment |
Parks |
|
|
FireDepartments |
Administrative Areas |
Fire Stations |
|
|
Schools |
Administrative Areas |
Schools |
|
|
Hospitals |
Administrative Areas |
Hospitals |
|
|
Historical Monuments |
Administrative Areas |
Parks & Rec Subtype |
|
|
Building or Facility |
Basemaps |
Table 4. Miscellaneous feature classes moved to other feature datasets.
Some additional feature classes in this small dataset were added (Figure 11). To support geometric networks, a companion feature dataset was created, which contains the networks for the improved schema, to avoid versioning conflicts.
This dataset was a workaround to support right-of-way functionality. The new parcel fabric construct in the improved schema (Figure 12) supports all the functionality built in to this dataset, and thus it was deprecated.
All the feature classes in this dataset were incorporated into the new Utility Networks dataset (Figure 10), which has been designed to support geometric networks.
A new feature dataset called Transportation_Networks was created to store future transportation networks, to keep them separate from the Transportation feature dataset in order to avoid version conflicts.
A new feature dataset called Utility_Networks was created to store future utility networks, to keep them separate from the Utilities feature dataset in order to avoid version conflicts.
In this step, we designed the final geodatabase data model based on the result of the conceptual modeling. A logical data model is a pictorial representation of the tables and relationships between the tables in the geodatabase.
We decided to use ESRI's Parcel Data Fabric structure in the Land Usage section of the geodatabase to model the city's land parcels. The figures below are the Unified Modeling Language (UML) representations of the conceptualized geodatabase objects in the improved geodatabase design. In the interest of time, Draw.io, an online diagramming application, was used to create the models.
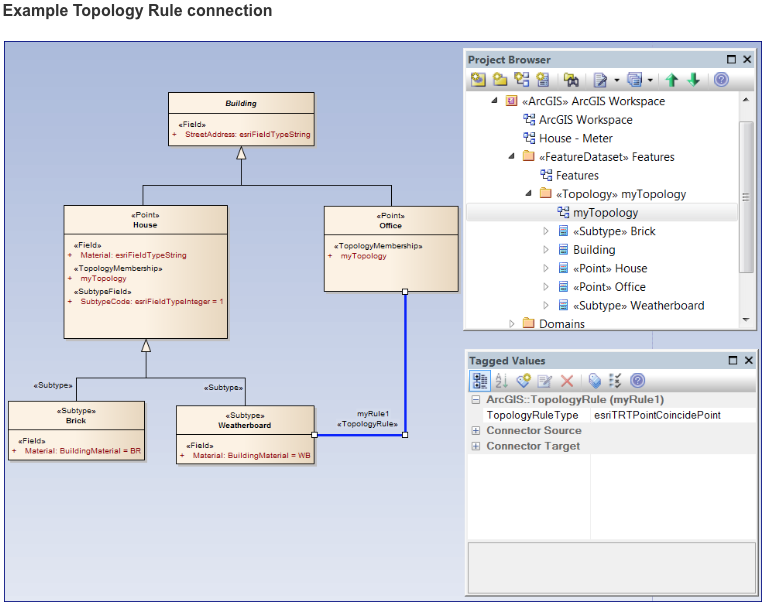
The UML notations in the diagrams below are defined as follows. A rectangle is any geodatabase object, unless specifically labeled as a feature dataset. If a rectangle is divided, the upper text is the name of the object, and the lower text elements are its attributes. If the lower text has an = sign, for example 0 = Elementary, the feature is a subtype. Solid lines define relationships, typically connecting primary key and foreign key. Dotted lines indicate spatial relationships, or topological rules, which are then defined at the bottom of a feature dataset diagram. If a number is present near where a line connects to a rectangle, this indicates the cardinality of the relationship: 1 = one, M = many. If the name of a feature has the word domain in it, the feature is a domain object. If a domain object’s lower text has equals signs, the domain is a set of coded values. If a domain object’s lower text has numbers separated by a minus sign, the domain represents a range. There are special notations in the Basemaps diagram. A dotted-lined rectangle is a table object. Below the name of the Salt River Project feature dataset is the name of its spatial reference, a projected coordinate system. The list of plain text is the dataset’s feature classes. The right-of-way feature class has a subtype.
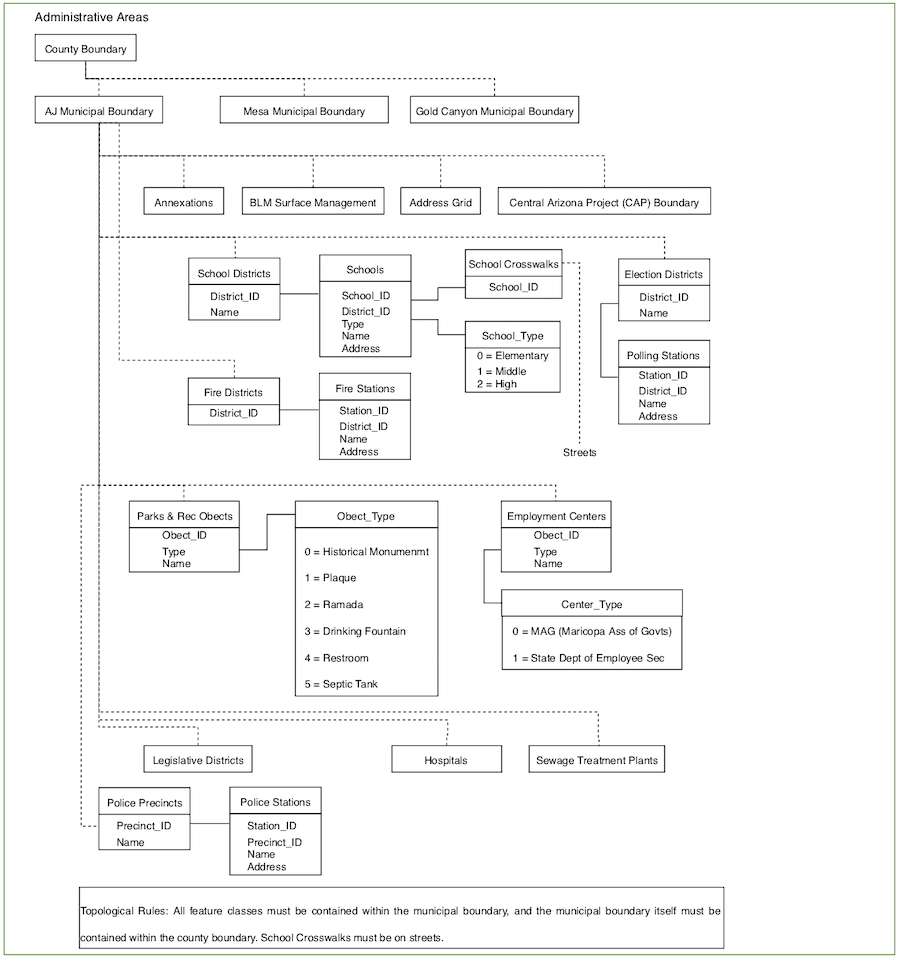
The Administrative Areas feature dataset contains feature classes that identify geopolitical responsibilities. All feature classes must be contained within the Apache Junction municipal boundary, which in turn must be contained within the county boundary. All fields that end in ID are primary or foreign keys. School districts contain schools, election districts contain polling stations, and police precincts contain police stations.
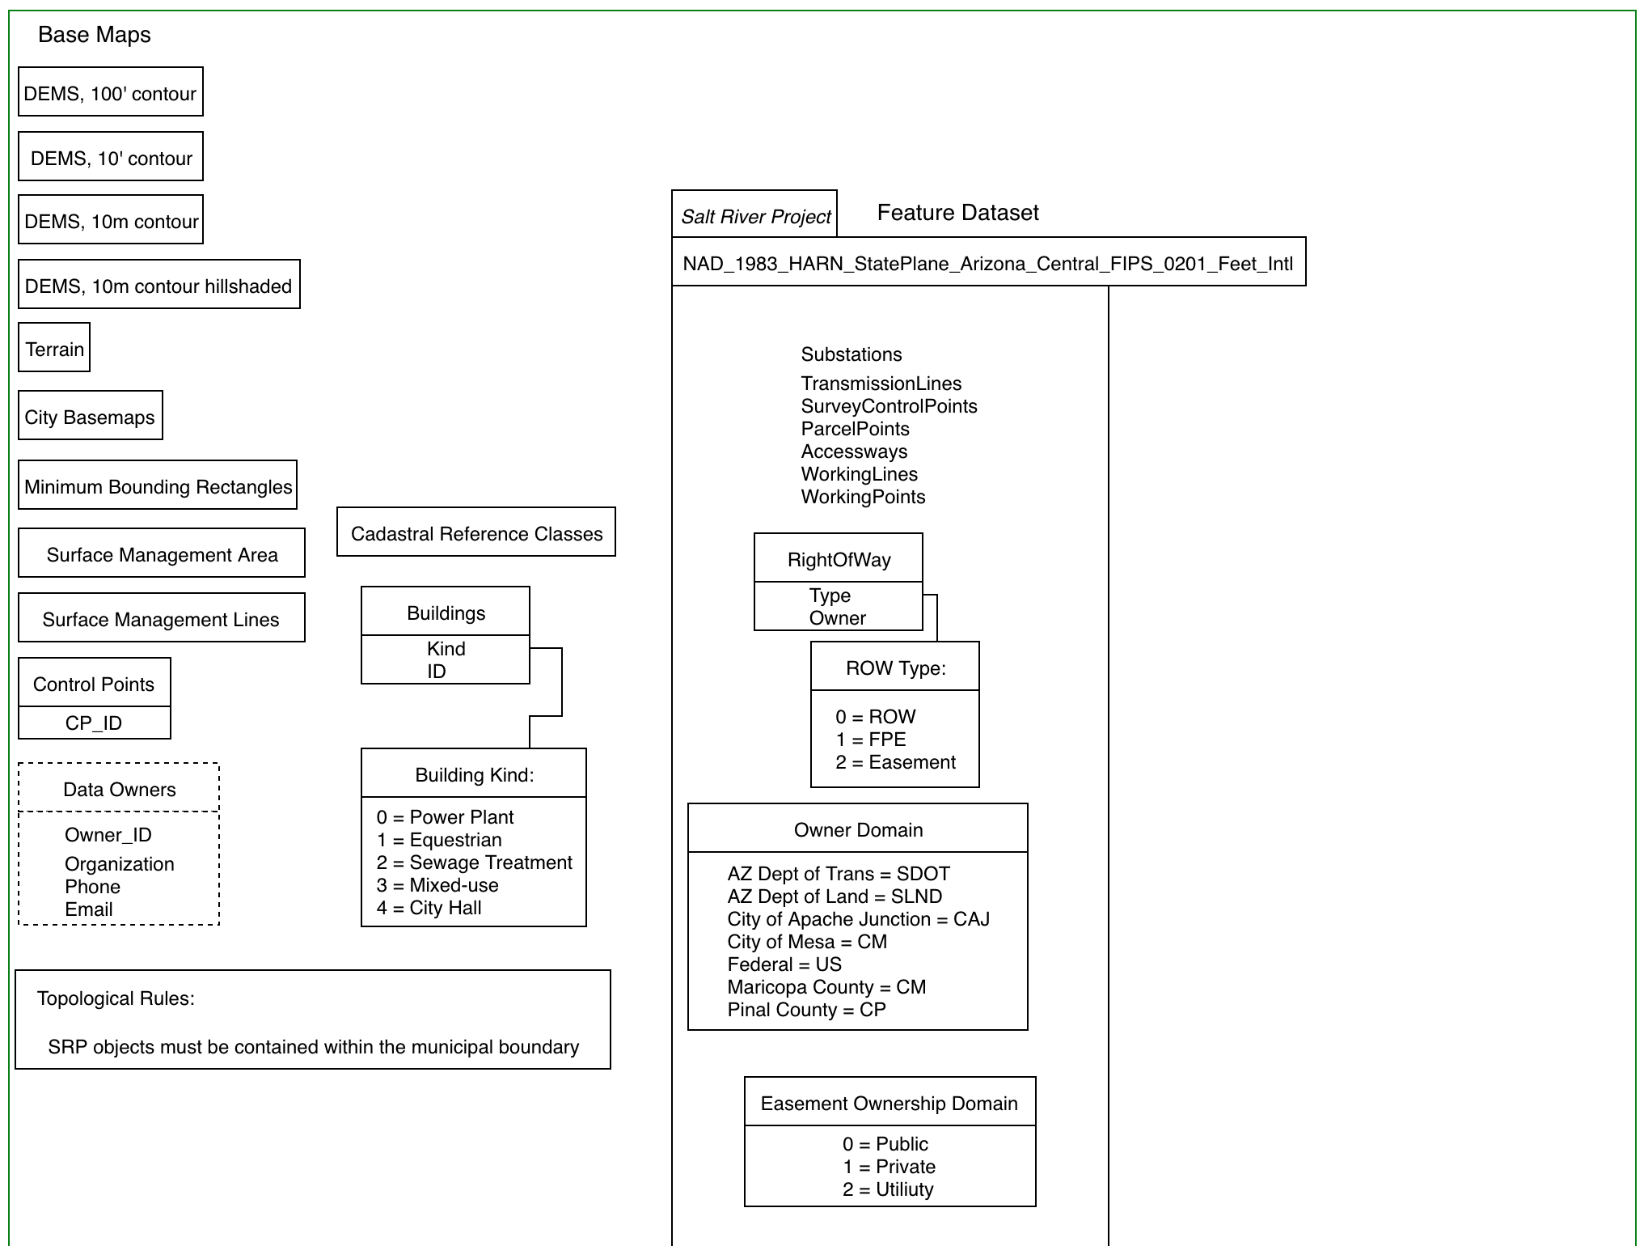
The Basemaps diagram is primarily a technical area of the schema intended for use by GIS personnel to maintain the system. It contains two feature datasets: Basemaps, and Salt River Project. The Basemaps feature dataset contains rasters, TIN surface objects, bounding rectangles, and other similar objects. The Salt River Project feature dataset holds data that the city uses in its GIS but belongs to the Salt River Project.
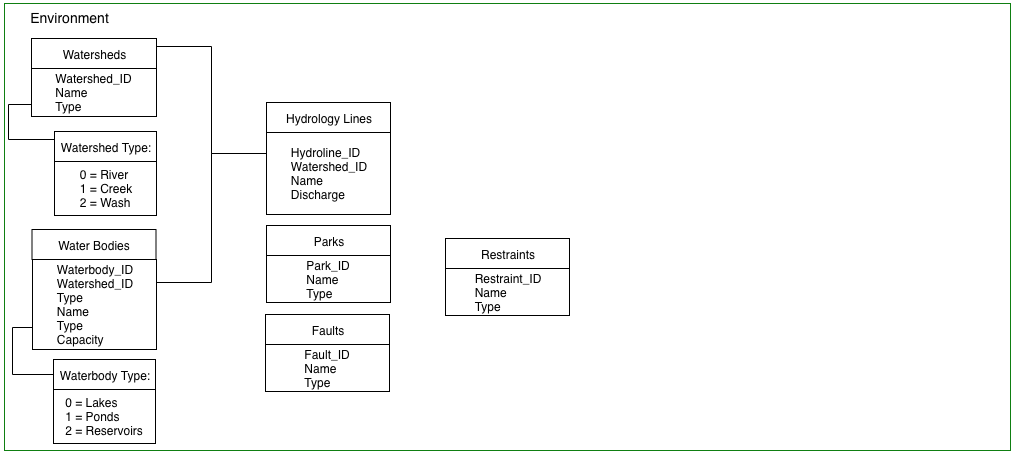
The Environment feature dataset contains features having to do with water and outdoor management. Watersheds and water bodies are subtyped, and water bodies relate to watersheds on a many-to-one basis.
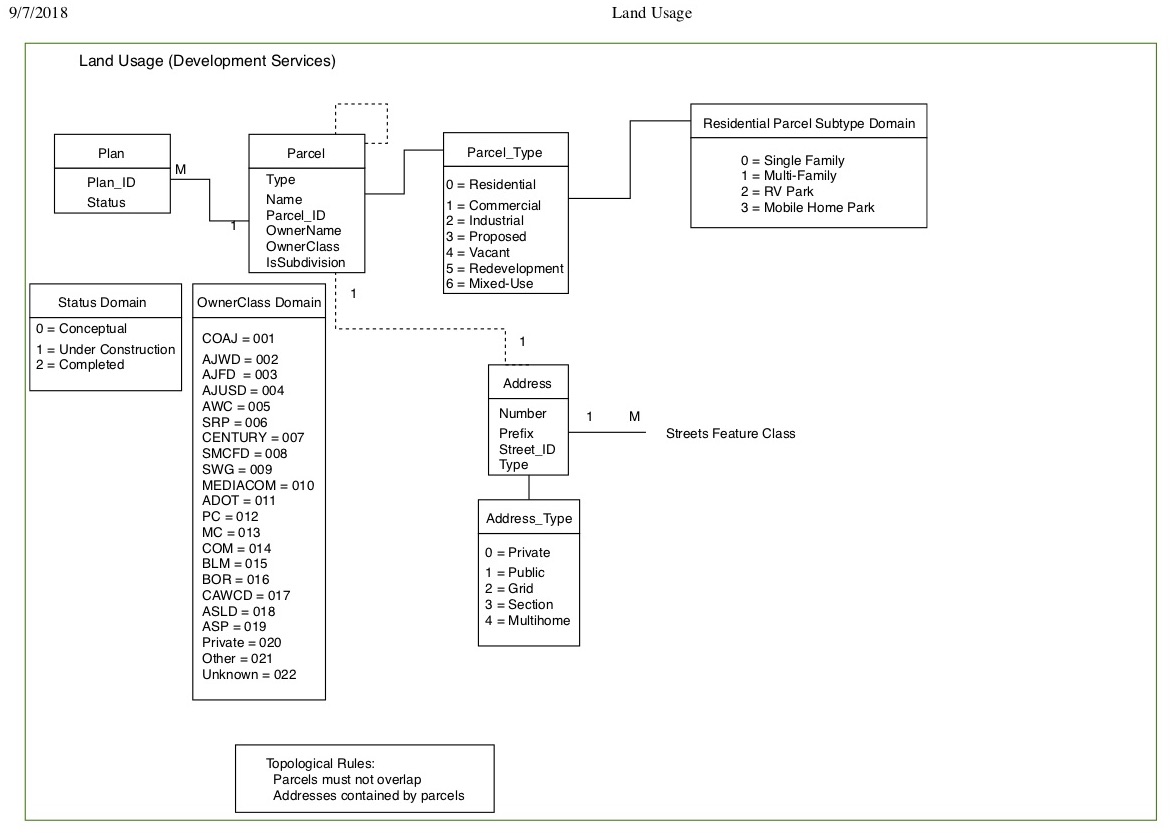
The Land Usage feature dataset contains features that the Development Services department uses on a daily basis. It contains the parcel data and parcel fabric data structure, parcel address, and owner information. The residential parcel subtype is constrained by a domain.
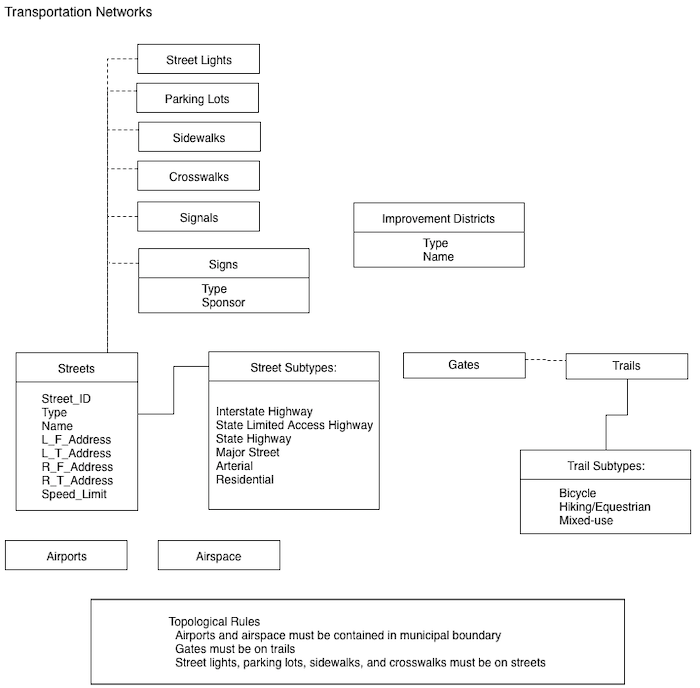
The Transportation feature dataset contains features that describe the city’s transportation systems. It has a companion feature dataset, Transportation Networks, that contains the transportation datasets’ transportation networks. Street-related features such as street lights, traffic signals and the like must be located on street features.
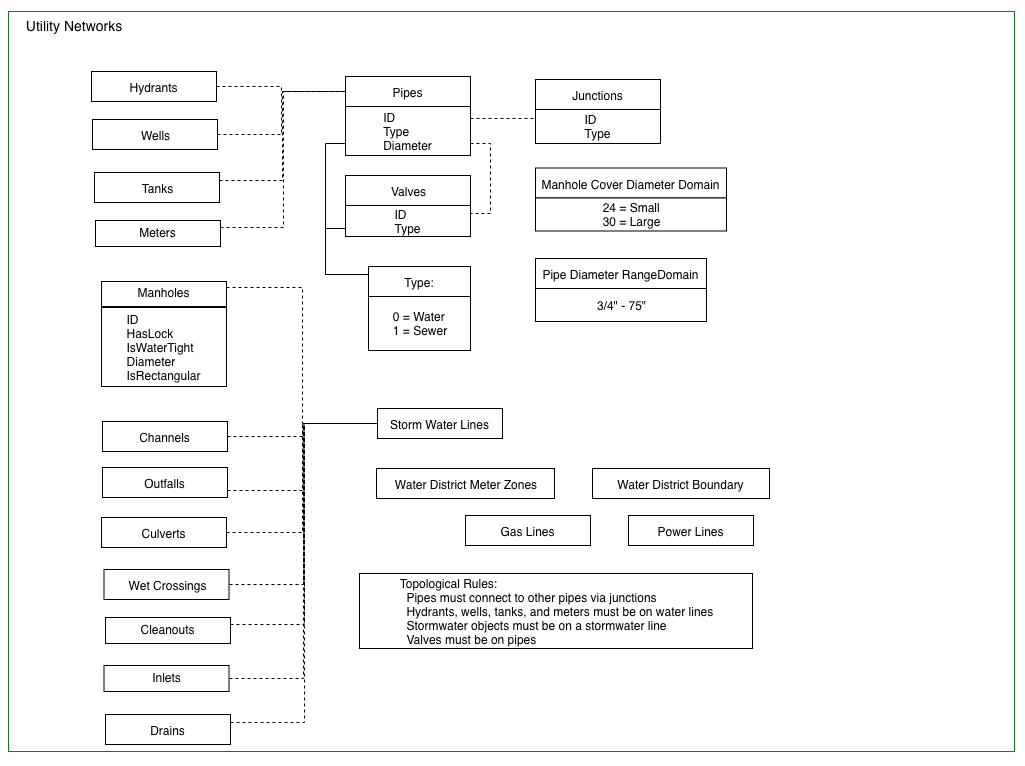
The Utility feature dataset contains features that describe the city’s utility services. It has a companion feature dataset, Utility Networks, that contains the transportation datasets’ utility (geometric) networks. A junction is both a feature class that represents a physical object and a GIS object that supports geometric networks, enabling determination of flow. Both pipes and valves are subtyped into water and server features. All storm water features must sit on a storm water line.
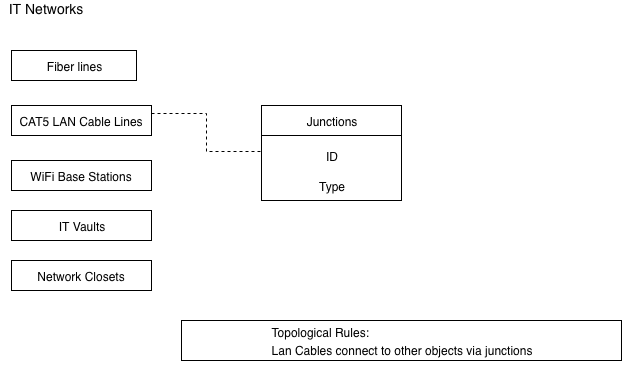
The IT (Information Technology) feature dataset contains features that describe the city’s information technology communications hardware. It has a companion feature dataset, IT Networks, that contains the IT datasets’ utility (geometric) networks. A junction is both a feature class that represents a physical object and a GIS object that supports geometric networks, enabling determination of flow. Fiberoptic lines have a reliable transmission limit measured in hundreds of miles, and do not need repeater support; CAT5 LAN ( Category 5 Local Area Network) lines have a recommended reliable transmission limit of 300 feet, and need repeater support.
This section discusses a suggested implementation of the resulting data model of this project.
Hardware and software requirements
The city of Apache Junction has chosen the ArcGIS platform (ArcGIS Desktop Version 10 and ArcGIS SDE Version 10) for Windows as their GIS system, and Microsoft SQL Server as the platform’s backend RDBMS. Therefore, the author recommends the following hardware requirements to support the system, application and middleware software on the server hardware:
· 2 TB of available hard disk space
· 16 GB of main RAM (Random Access Memory)
· 2 GHz 64-bit CPU (Central Processing Unit)
ArcGIS SDE version 10, and its SQL Server backend RDBMS (Relational DataBase Management System), will run on all Windows server operating systems versions 2012 R2 or later. This system software configuration will also support connection middleware and other required business object middleware.
All of the feature datasets, networks, and feature classes in the GIS are to be set to the following spatial reference configuration, as specified by the city’s GIS coordinator:
NAD 1983 HARN StatePlane Arizona East FIPS 0201 (Intl
    Feet)
(NAD_1983_HARN_StatePlane_Arizona_East_FIPS_0201_Feet_Intl)
Resolution: 1/120'
WKID: 2867 Authority: EPSG
Projection: Transverse_Mercator
False_Easting: 700000.0
False_Northing: 0.0
Central_Meridian: -110.1666666666667
Scale_Factor: 0.9999
Latitude_Of_Origin: 31.0
Linear Unit: Foot (0.3048)
Geographic Coordinate System: GCS_North_American_1983_HARN
Angular Unit: Degree (0.0174532925199433)
Prime Meridian: Greenwich (0.0)
Datum: D_North_American_1983_HARN
Spheroid: GRS_1980
Semimajor Axis: 6378137.0
Semiminor Axis: 6356752.314140356
Inverse Flattening: 298.257222101
We have chosen Sparx Systems’ Enterprise Architect as the data model editing software package. Enterprise Architect has the capability of exporting the entire data model, in the object order that the developer specifies, into an XML file that ArcGIS SDE can read and import. Therefore, after the ArcGIS SDE system is setup and working properly, GIS personnel can initiate import of the data model (schema) directly into the geodatabase via the XML file (Figure 13).
Once the basic objects of the data model, such as the feature datasets, feature classes, table objects, domains, and topologies have been imported into the geodatabase, GIS personnel can modify the data model to their current requirements. Later, if and/or when the city acquires an ESRI license agreement, the objects to support advanced features such as geometric networks will be present in the data model to support those features.
Once the geodatabase has been properly configured, data entry/import can begin. For data already in the city’s existing geodatabase, the GIS coordinator can perform the imports into the new data model. For data not already in the geodatabase but not stored electronically, such as data on paper maps, GIS personnel and those assisting them will have to enter the data and validate it manually.
Spatial data stored electronically in hosts such as Microsoft Access or Microsoft Excel may have to be modified in advance of import into the geodatabase, once the data has been exported out of those environments. The ArcGIS platform has features that can assist with this, such as adding XY data and the Geocoding feature. For spatial data stored in CAD software, the ArcGIS platform has a special tool called CAD to geodatabase that supports the import of spatial data in those environments into an ArcGIS geodatabase.
The process of successfully importing
data that has been stored in proprietary software packages that city
departments use will depend on how the data is stored and what import/export
features the software supports. However, business-to-business data
transformation procedures can be developed for these specialized situations.
|
1st week of August 2017 |
Practicum began |
|
3rd week of August 2017 |
Practicum contract written and signed |
|
December 15, 2017 |
Strategic GIS Implementation Plan completed; paid portion of practicum complete |
|
3rd week of September 2018 |
Practicum proposal OK'd by committee with revisions |
|
4th week of September 2018 |
Incorporate proposal revisions; begin writing practicum report based on finalized proposal |
|
End of semester Fall 2018 |
Incorporate 1st and 2nd draft thesis revisions |
|
Beginning of semester Spring 2019 |
Continue incorporating revisions |
|
January 30, 2019 |
Turn in paper version of final version of the thesis to GPR Dept |
|
February 11, 2019, 11:30 AM |
Practicum Defense presentation |
Table 5. Timeline
This report has defined and discussed the design of an Enterprise GIS schema for the city of Apache Junction, conducted during the fall of 2018 by the author. Assisted by the city’s GIS coordinator, he conducted the end user meetings, compiled the initial business functions, and created the conceptual and logical models.
Implementation of the design, overseen by the city's GIS coordinator, will centralize, standardize, and maintain the accuracy, integrity, and ownership of the city's geographic data. Paper maps and drawings formerly processed by hand will be converted to electronic format, and procedures will be automated and streamlined. The implemented design will be flexible enough to scale up to support future GIS functions such as networks, spatial analysis, and data input from mobile devices. As the city’s The Apache Junction City Council has seen the value of the project and has approved an implementation plan, written by the author with assistance from the GIS coordinator. The resulting project report will provide another success story to the geospatial science community by documenting the GIS system's implementation.
Dev Services and Parks and Recreation
September 7, 2017 4 pm
Development Services Large Meeting Room
John Bonifas, J.C. Kliner, Nick Blake, Stephanie Bubenheim, Dave Zellner, Mike Loggins, Larry Kirch, Liz Langenbach
-
Public Works
September 8, 2017 3:30 pm
Public Works Meeting Room
John Bonifas, J.C. Kliner, Emile Schmid, Shane Kiesow, Mike Wever
Water, PD, Economic Development, and City Clerk
September 14, 2017 3:30 pm
Development Services Large Meeting Room
John Bonifas, J.C. Kliner, Mike Loggins, Christina Caswell, Janine Hanna-Solley